

Most businesses don’t need more channels. They need a clearer view of how everything connects – and how that connection turns into visibility, enquiries and pipeline.
That’s why we’ve launched the EI digital ecosystem diagram. It’s a simple, top-level map of the marketing and technology areas that shape growth, plus the practical building blocks that make them work together.
Clarity that protects budget and accelerates outcomes
Digital often underperforms for one reason: it’s treated as a set of separate tasks. Websites get rebuilt, ads get launched and social gets posted, but the handoffs between them are weak and measurement is inconsistent.
When the ecosystem is joined up, each part does less heavy lifting on its own. Your website converts more of the demand you already have, SEO compounds over time, paid activity becomes more efficient and automation reduces friction for your team.
Not every business needs every part of the ecosystem
This diagram isn’t a checklist. It’s a map.
For some businesses, a fast, accessible website and a tight SEO plan are the right foundations. For others, paid media and landing page testing will drive quicker momentum. And for teams with operational complexity, software, integrations or automation might unlock the biggest gains.
The point is to help you see the full landscape, then choose what’s relevant based on your goals, your budget and your stage of growth – without overcommitting or spreading effort too thin.
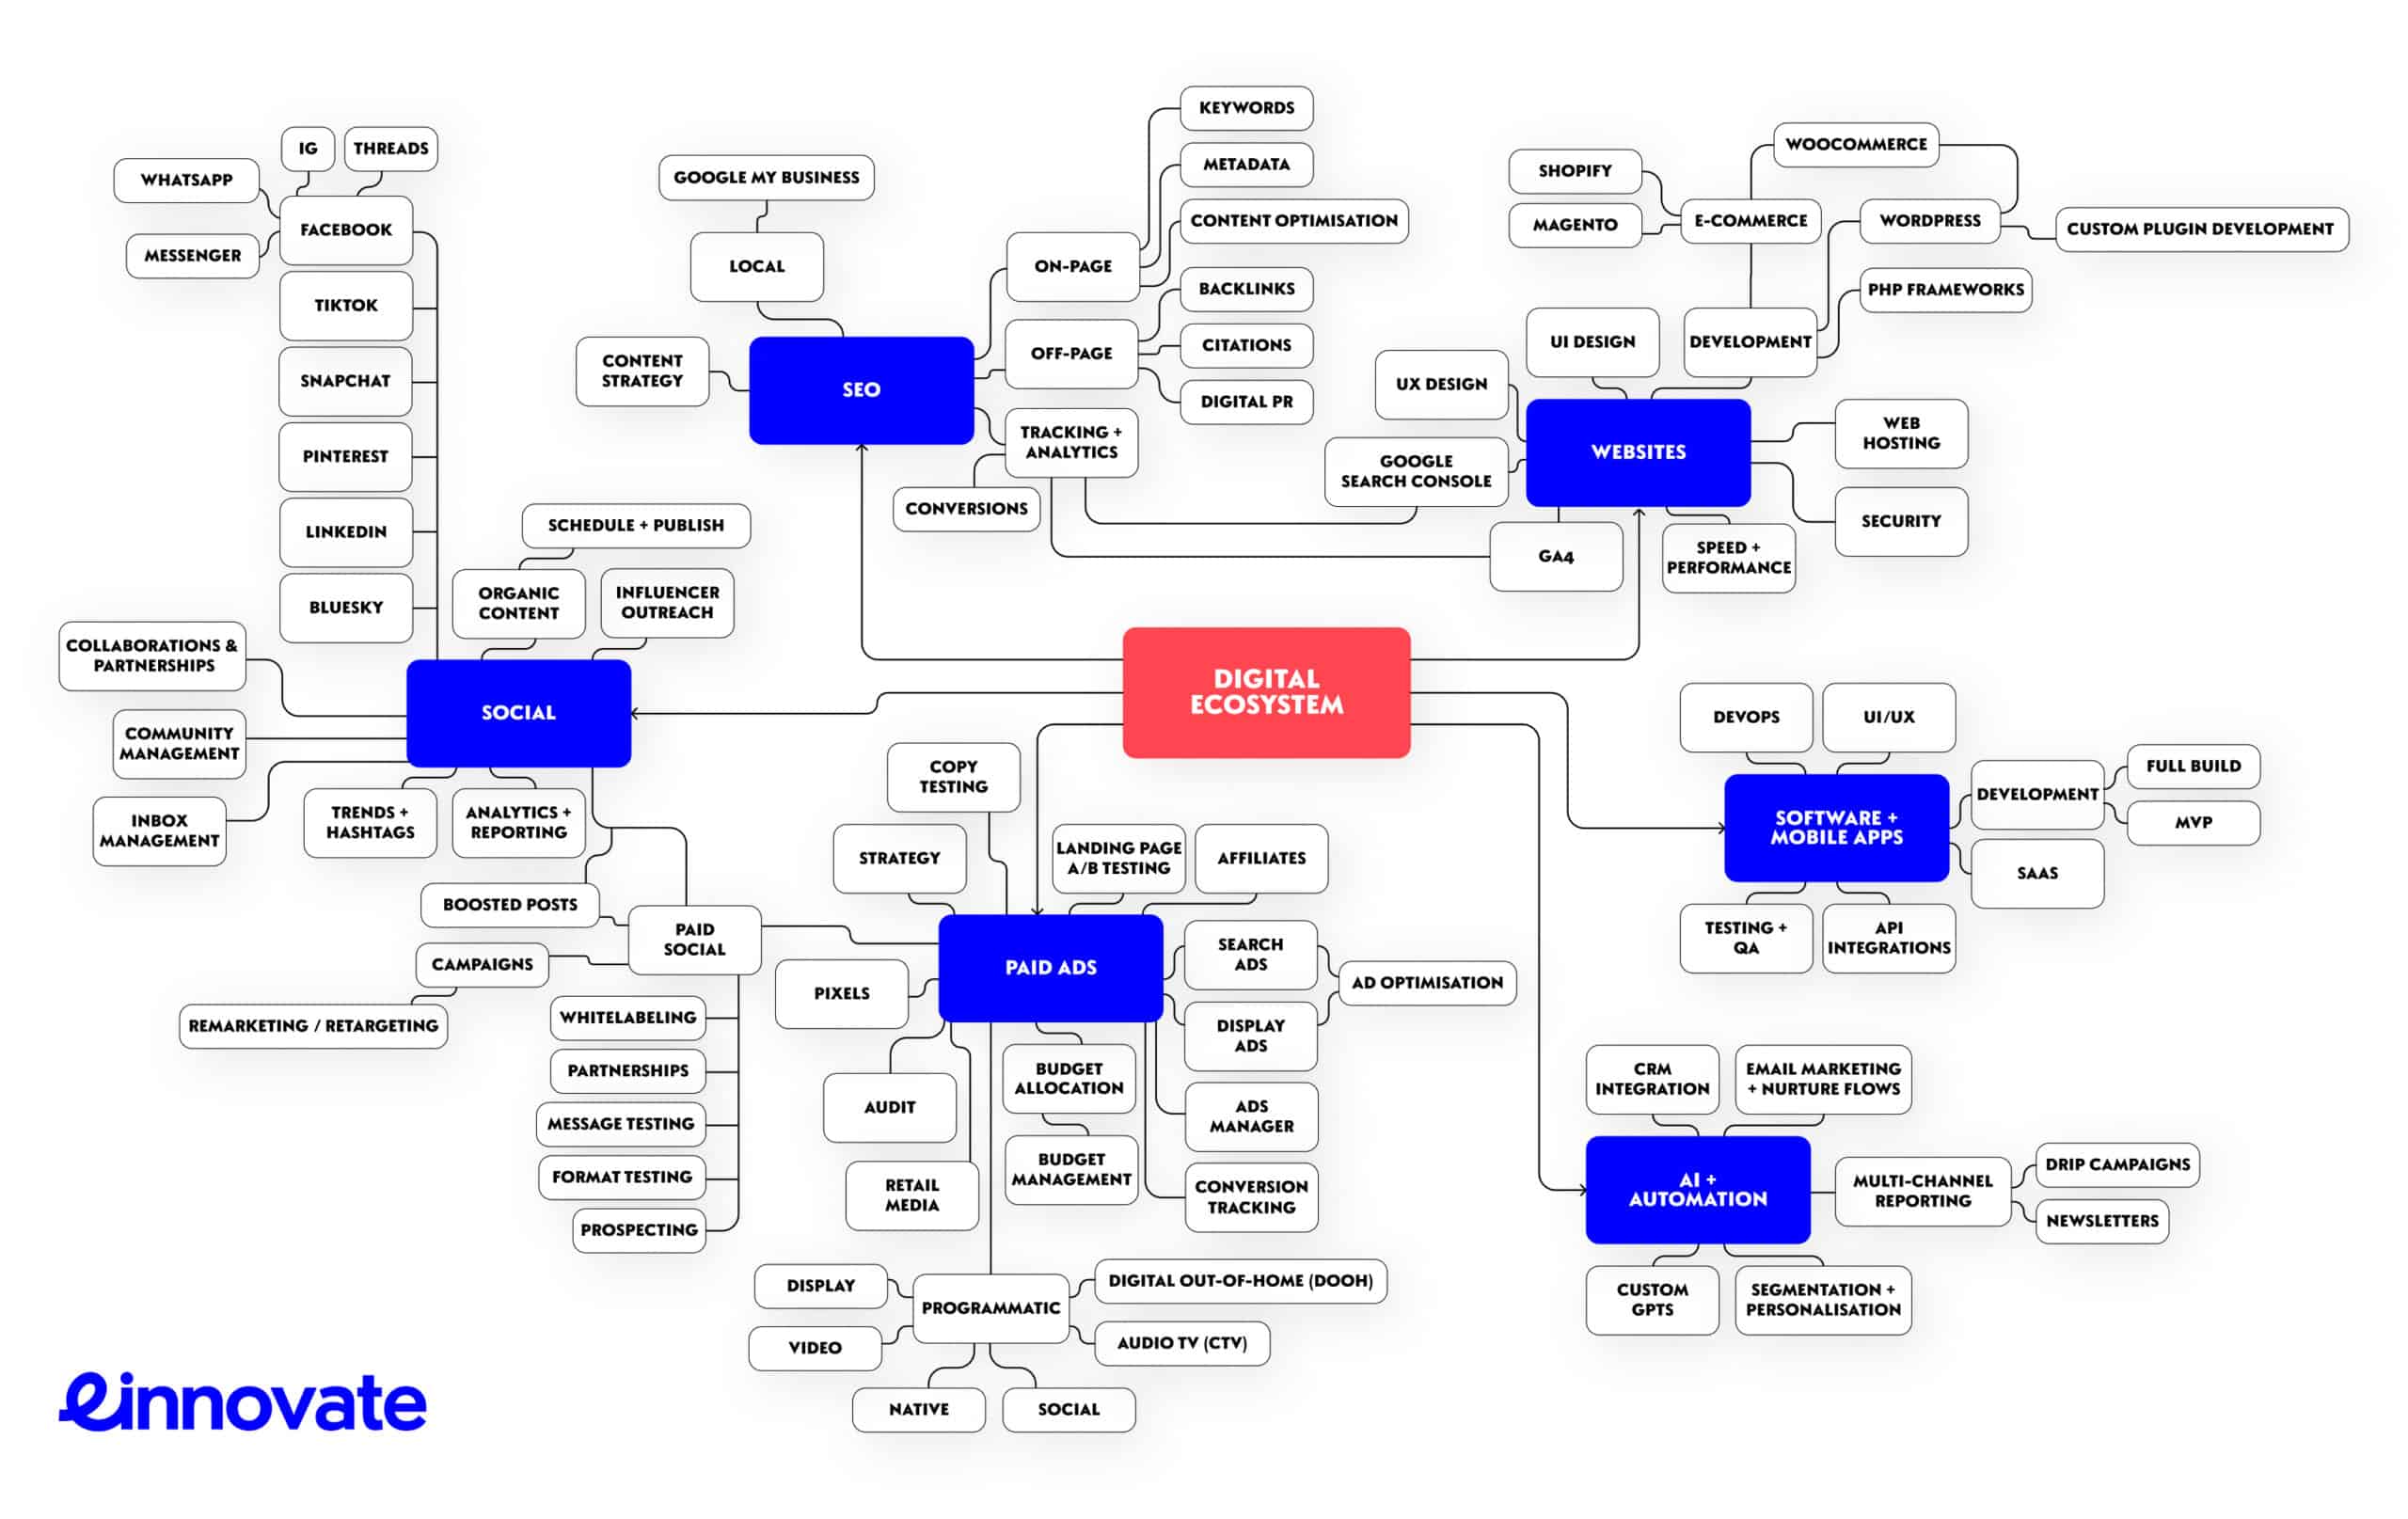
A top-level map of what to consider
The diagram is designed to be broad on purpose. It gives you a single view of the main disciplines that influence growth, without forcing you into a one-size-fits-all plan.
It clusters activity into six areas:
- Websites – UX, design, development, performance, hosting and security
- SEO – content strategy, on-page optimisation, authority building and analytics
- Paid ads – strategy, testing, search and display, tracking and optimisation
- Social – organic content, community, partnerships, reporting and paid social
- Software + mobile apps – MVPs, SaaS, integrations, QA and delivery
- AI + automation – Custom GPTs, CRM integration, nurture flows and reporting
How to use the diagram in your business
Start by highlighting what you actively do today, then mark what you rely on for revenue. The gaps between those two usually explain why performance feels unpredictable.
Next, look for broken connections. Common examples include strong traffic but weak conversion, paid campaigns without clean tracking, or content that isn’t aligned to search intent and landing pages.
Finally, prioritise what will improve outcomes fastest. That usually means measurement first, conversion next, then scaling demand capture across SEO and paid with a consistent message.
What we mean by an ecosystem (not a long list of services)
An ecosystem is only useful if it helps you make decisions. The diagram is a conversation tool to align stakeholders, challenge assumptions and create a roadmap that fits your business.
It’s also a reminder that “more activity” is not the same as “more growth”. The goal is a system where each part strengthens the next – and you can prove it in the numbers.
If you want, we’ll map your current ecosystem
If you’d like a second pair of eyes, we can run a quick ecosystem review. We’ll identify what’s working, where value is leaking and which improvements are most likely to increase visibility, enquiries and pipeline.
Book a consultation to see how this could work for your business